Clay's Ferry, Lexington Real Estate & Homes For Sale
3 homes
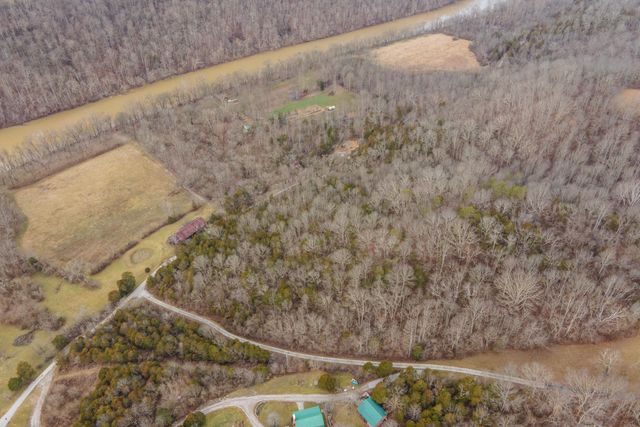
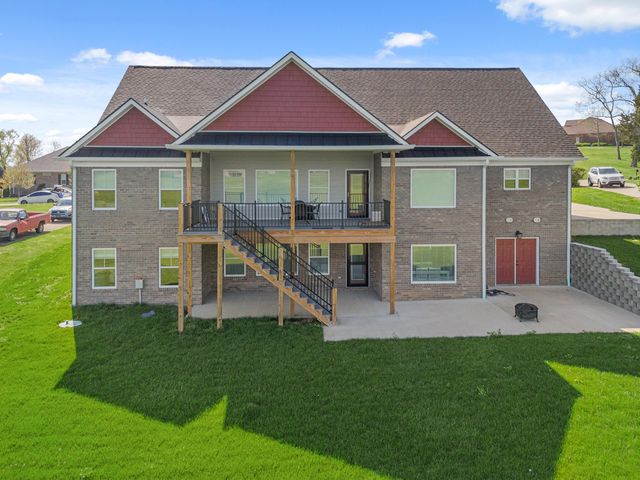
 Use arrow keys to navigate10.69 ACRESRe/Max Elite Realty, Bluegrass REALTORS®
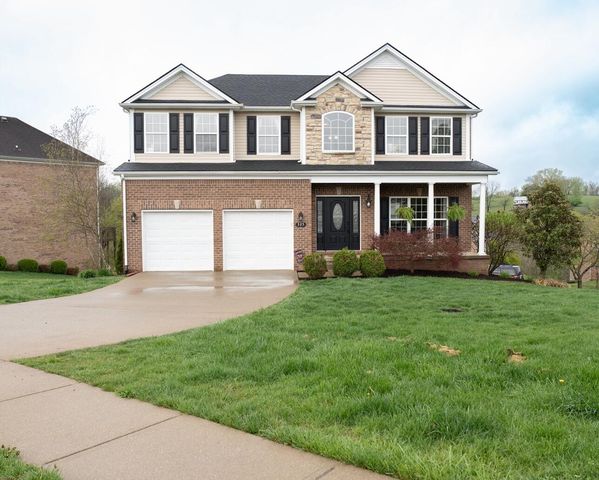
 Use arrow keys to navigateTru Life Real Estate, Bluegrass REALTORS®
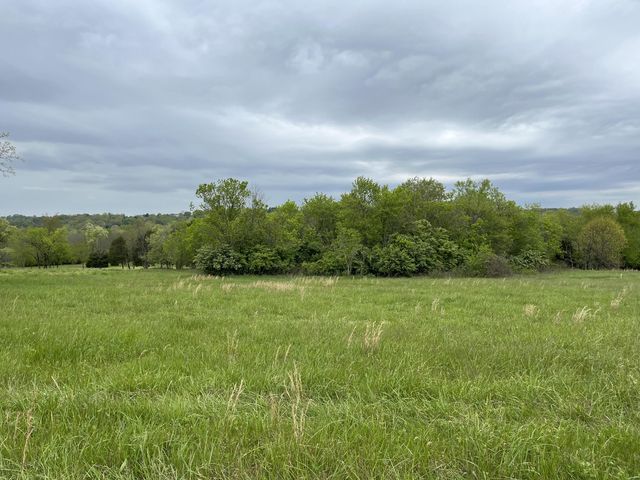
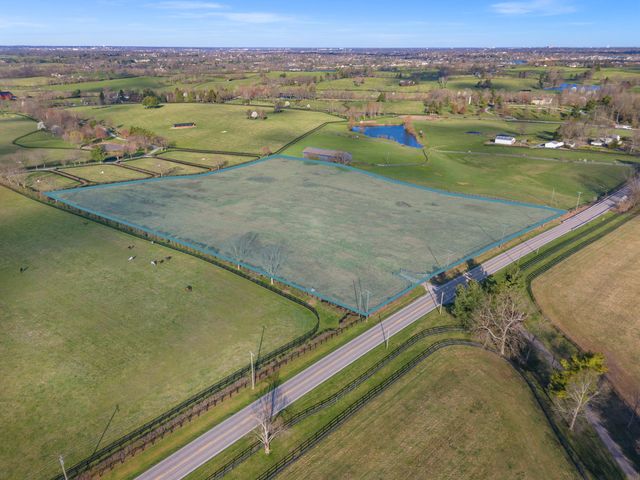
 Use arrow keys to navigate10 ACRESChristie's International Real Estate Bluegrass, Bluegrass REALTORS®


Homes Near Clay's Ferry, Lexington, KY
We found 30 more homes matching your filters just outside Clay's Ferry
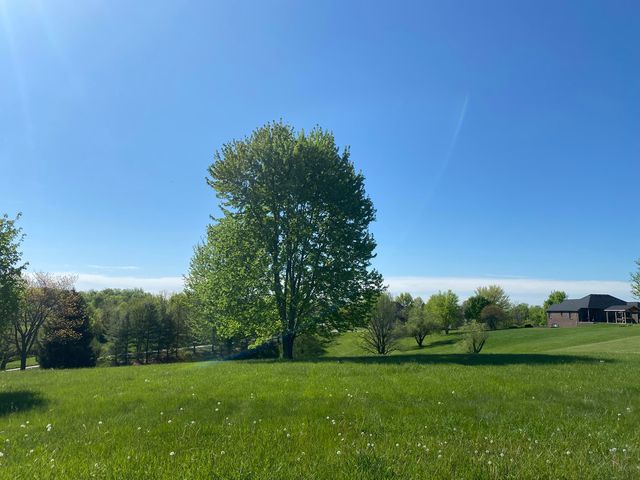
 Use arrow keys to navigateNEW - 4 HRS AGO9.26 ACRESBluegrass Properties Group, Bluegrass REALTORS®
 Use arrow keys to navigateNEW - 1 DAY AGO0.56 ACRESKeller Williams Bluegrass Realty, Bluegrass REALTORS®
 Use arrow keys to navigateNEW - 1 DAY AGO0.55 ACRESRe/Max Elite Lexington, Bluegrass REALTORS®
 Use arrow keys to navigate0.28 ACRESCentury 21 Advantage Realty, Bluegrass REALTORS®
 Use arrow keys to navigateNEW CONSTRUCTION10.05 ACRESThe Real Estate Co., Bluegrass REALTORS®
 Use arrow keys to navigate0.48 ACRESPr Realty Group, LLC, Bluegrass REALTORS®
 Use arrow keys to navigate0.39 ACRESKeller Williams Legacy Group, Bluegrass REALTORS®
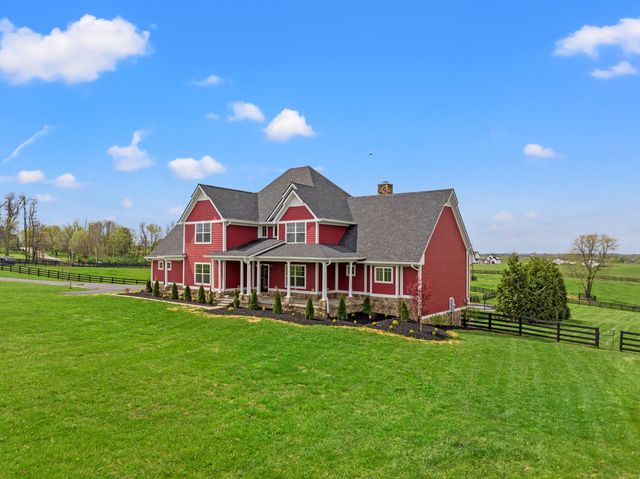 10.13 ACRESTom Harper And Associates, Bluegrass REALTORS®
 0.55 ACRESKeller Williams Commonwealth, Bluegrass REALTORS®
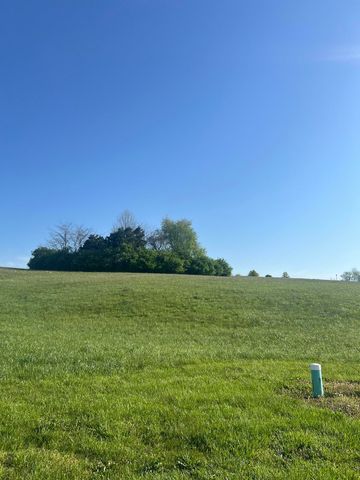 0.54 ACRESKeller Williams Commonwealth, Bluegrass REALTORS®
 0.37 ACRESKeller Williams Commonwealth, Bluegrass REALTORS®
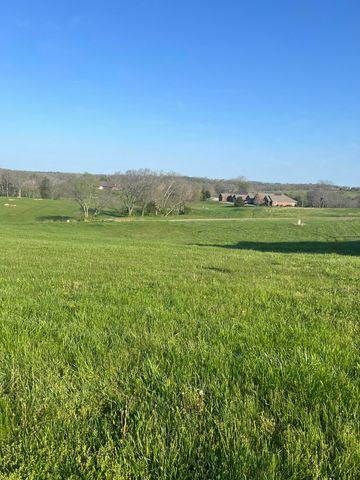 0.49 ACRESKeller Williams Commonwealth, Bluegrass REALTORS®
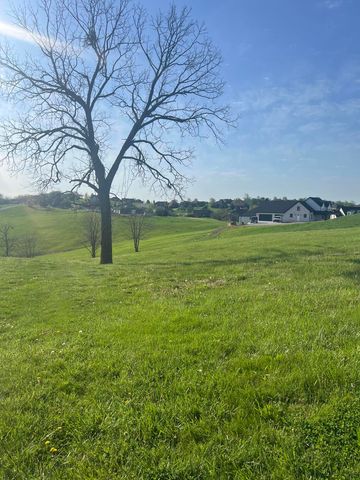 0.39 ACRESKeller Williams Commonwealth, Bluegrass REALTORS®
 0.54 ACRESKeller Williams Commonwealth, Bluegrass REALTORS®
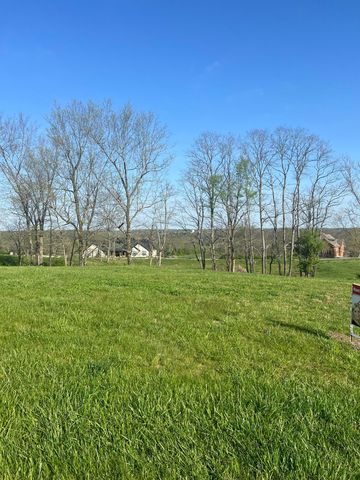 0.52 ACRESKeller Williams Commonwealth, Bluegrass REALTORS®
 0.83 ACRESKeller Williams Commonwealth, Bluegrass REALTORS®
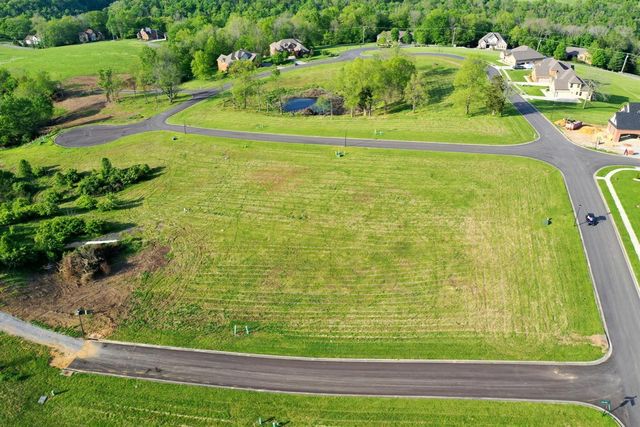 0.43 ACRESKeller Williams Commonwealth, Bluegrass REALTORS®
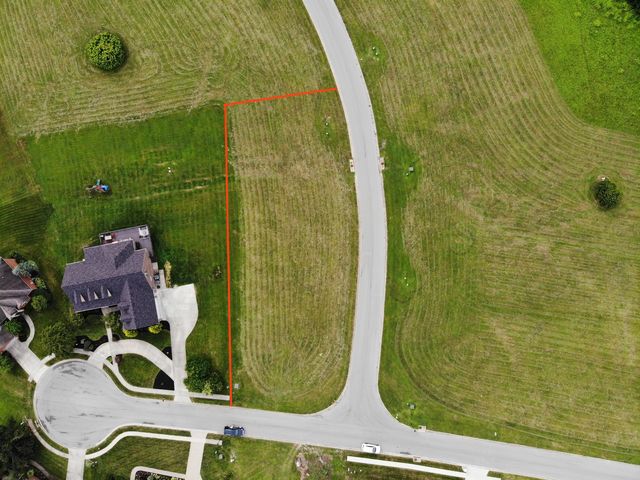 0.63 ACRESKeller Williams Commonwealth, Bluegrass REALTORS®
 1.04 ACRESKeller Williams Bluegrass Realty - Lake Cumberland, Bluegrass REALTORS®
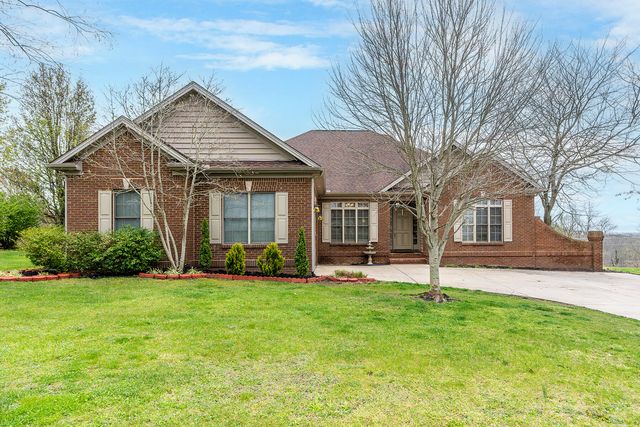 0.39 ACRESKeller Williams Legacy Group, Bluegrass REALTORS®
 0.4 ACRESLegacy Real Estate Firm, Bluegrass REALTORS®
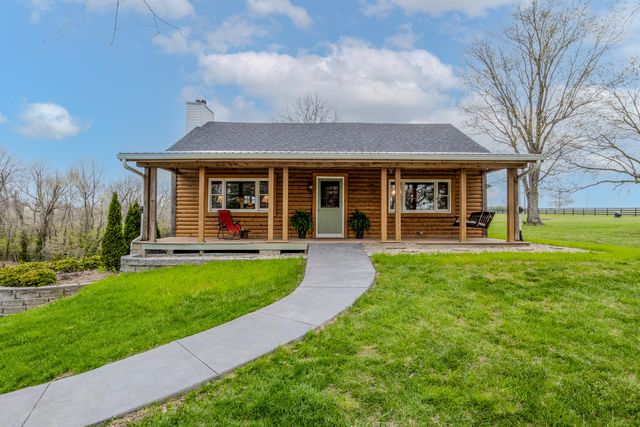 11.2 ACRESTurf Town Properties, Bluegrass REALTORS®
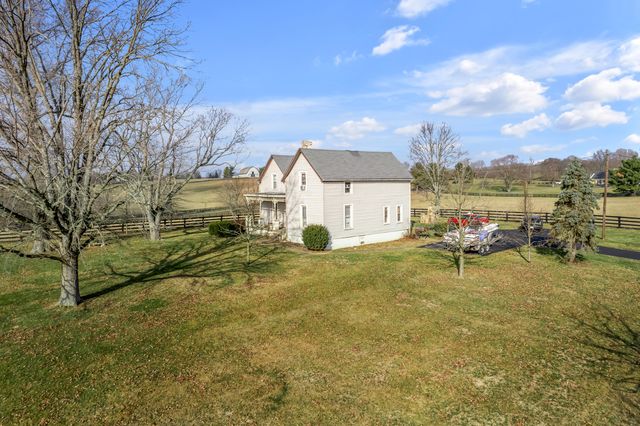 21.41 ACRESBluegrass Sotheby's International Realty, Bluegrass REALTORS®
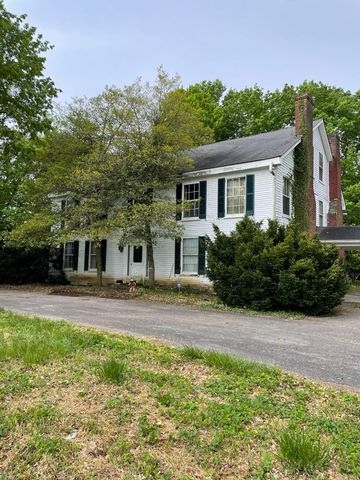 8 ACRESBerkshire Hathaway De Movellan Properties, Bluegrass REALTORS®
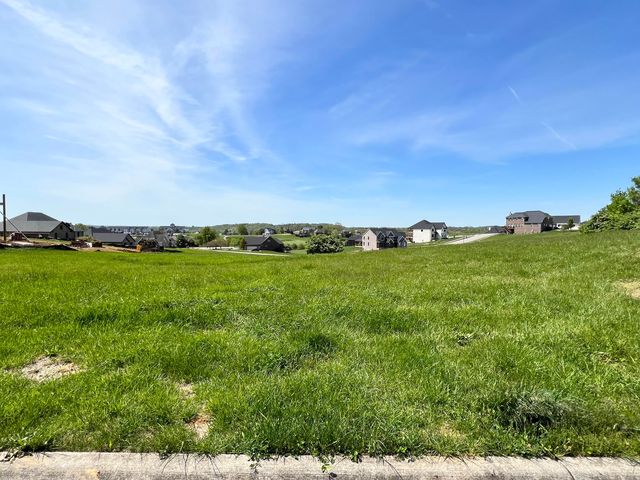 0.42 ACRESKeller Williams Legacy Group, Bluegrass REALTORS®


Clay's Ferry, Lexington, KY Real Estate Trends
Learn about the Clay's Ferry, Lexington, KY housing market through trends and averages.
Affordability of Living in Clay's Ferry, Lexington, KY
The median home value is $452,994
| Month | Median home value |
|---|---|
| April 2023 | $410k |
| May 2023 | $417k |
| June 2023 | $423k |
| July 2023 | $428k |
| August 2023 | $432k |
| September 2023 | $436k |
| October 2023 | $439k |
| November 2023 | $443k |
| December 2023 | $445k |
| January 2024 | $447k |
| February 2024 | $449k |
| March 2024 | $453k |
View as a graph
Trends and affordability stats are provided by third party data sources.

IDX information is provided exclusively for personal, non-commercial use, and may not be used for any purpose other than to identify prospective properties consumers may be interested in purchasing. Information is deemed reliable but not guaranteed.
The listing broker’s offer of compensation is made only to participants of the MLS where the listing is filed.
The listing broker’s offer of compensation is made only to participants of the MLS where the listing is filed.